
The AM11 Acoustimeter - Peak and Average - Why are there two different readings?
The AM11 Acoustimeter is unique in the way it displays information about its measurements. There are two different displayed results showing both Peak and Average measurements on the LCD and also using two rows of LEDs.
At first, this may seem confusing and make the readings difficult to understand. However, we believe that they are both important in assessing your exposure to modern telecommunication signals and that they both need measuring and displaying.
Digital and Analogue: What is the difference?
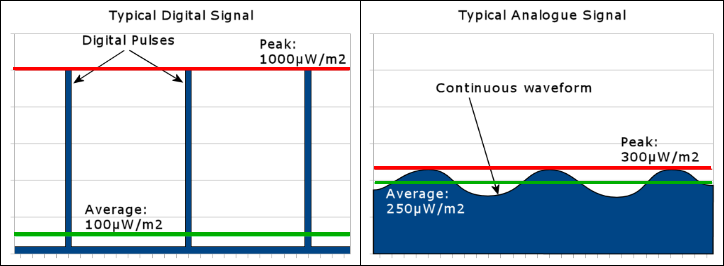
Many modern wireless devices use a digital system of communicating. This includes Mobile Phones (GSM & 3G/UMTS and 4G/LTE), WiFi, Cordless phones (DECT), Digital TV & Digital (DAB) Radio (Although there are also analogue TV & Radio stations, but most of these have been phased out). Many modern digital systems (such as GSM, LTE, DECT and WiFi) turn the signal on and off at high speeds to represent data, often with long gaps between data bursts. This produces a non-continuous signal, which we also call "pulsing".
An analogue signal is a system of communication that is not digital. The old TV system, most radios, walkie-talkies and hearing aids are examples of analogue signals. It uses a continuous waveform, and instead of turning on and off to represent data, it will vary its frequency (FM) or strength (AM).
How this affects Peak and Average
With an analogue system, the peak and average levels should be similar, as the signal is continuously on while it is being used. However, because most digital systems spend a large proportion of their time not transmitting, the average level does not represent the actual waveform even though it's technically accurate. Because of this, you don't see the fact that you actually have much more powerful pulses of much higher signal strength, but only for very short periods of time. See the diagrams for a visual example.
Why does this matter?
Traditionally, the only method used to measure exposure has been the average, due to wireless communication having been exclusively analogue until the past couple of decades. It is also the most sensible metric to use when looking at thermal effects, which for a long time was the only "established" mechanism for health effects caused by EMFs. You will see averaged figures used by the government and industry, as well as in most scientific studies and even precautionary guidelines. The metric typically used for measuring the averaged power of microwave frequency EMFs is microwatts per square metre (µW/m2), and so we have used this for the Acoustimeter's average power measurement.
However, there have now been hundreds of studies finding non-thermal effects from EMFs, which means that the measurement system needs to be re-addressed to suit much lower signal levels and very different characteristics. We believe that peak signal strength is an appropriate way to measure digital, non-continuous signals in a meaningful manner. Signal strength measured in volts per metre (V/m) is a suitable metric for this. Many electrosensitive individuals report adverse health effects in areas that have average field strengths below some of the more precautionary guidelines, but still have high peak levels.
You can mathematically convert between V/m and µW/m2, but this is only accurate if you have an analogue, continuous waveform. Please use the units conversion facility on the Acoustimeter page.
What do the different LED colours mean?
Our peak scale is based on personal experience of what electrosensitive individuals have reported as adversely affecting their health. Below 0.05 V/m, few people report ill-effects, so these are green. Between 0.05 and 0.5 V/m, some individuals report ill-effects, so these are yellow. Above 0.5 V/m, nearly all electrosensitive individuals report experiencing adverse health effects, so these are red.
The average scale uses orange LEDs. We do not believe we know of a reasonable safe/not safe point that would allow us to use more than one colour here. We believe it is the peak levels that are most important as regards any bio-effects.